Tables and Figures (Notebook)
from pathlib import Path
from encoders.tables import get_table_regression_params, get_table_rse_practices
from encoders.plot import plot_figure1, plot_figure2, plot_figure3
from encoders.utils import load_config
Tables
The cells below render the imported tables.
get_table_regression_params() # returns a GT() objectLoading...
get_table_rse_practices()Loading...
Figures
Below we use encoders.plots.plot_figure1 to reproduce plots that were shown in Figure 1. The code below assumes you have downloaded the precomputed results and you have a folder locally with the following subfolders:
./runs  # can be named anything you like
├── extension_ridgeCV
├── replication_bootstrap
├── replication_ridge_huth
├── replication_ridgeCV
└── reproduction
Figure 1 (Reproduction and replication)
RESULTS_DIR = load_config()["RESULTS_DIR"]
SAVE_PATH = "./fig/manuscript_figures"
%matplotlib agg
plots_figure_1 = plot_figure1(
reproduction_dir=Path(RESULTS_DIR, "reproduction"),
replication_ridgeCV_dir=Path(RESULTS_DIR, "replication_ridgeCV"),
save_figures=False,
save_path=None,
)Loading...
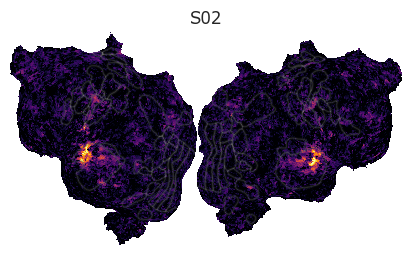
Reproduction experiment
reproduction_training_curve = plots_figure_1[0]
reproduction_brain = plots_figure_1[2]
fig = reproduction_training_curve # instance of matplotlib Figure
fig.axes[0].set_title("Training curve (Reproduction experiment)")
fig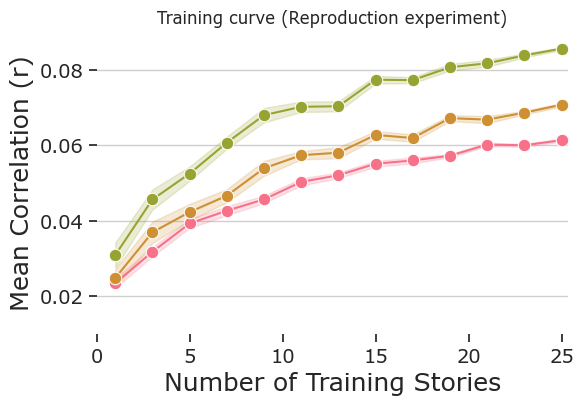
fig = reproduction_brain
fig.axes[0].set_title("S02")
fig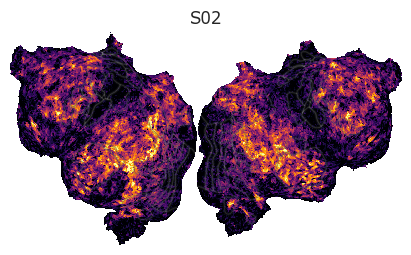
Replication experiment
replication_training_curve = plots_figure_1[1]
replication_brain = plots_figure_1[3]
fig = replication_training_curve
fig.axes[0].set_title("Training curve (Replication experiment)")
fig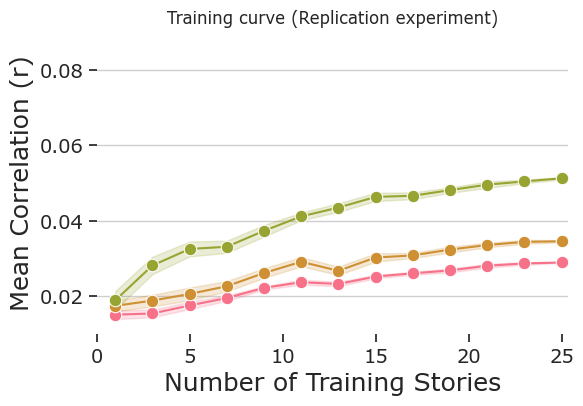
fig = replication_brain
fig.axes[0].set_title("S02")
fig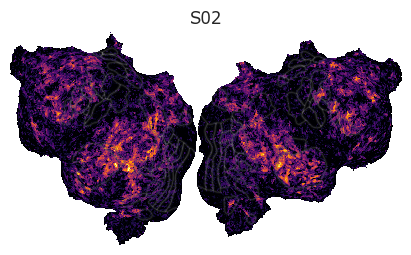
Figure 2 (Patching experiment)
Replication and patching
%matplotlib agg
plots_figure_2 = plot_figure2(
    replication_ridgeCV_dir=Path(RESULTS_DIR, "replication_ridgeCV"),
    replication_bootstrap_dir=Path(RESULTS_DIR, "replication_bootstrap"),
    replication_ridge_huth_dir=Path(RESULTS_DIR, "replication_ridge_huth"),
    save_figures=True,
    save_path=None
)
Loading...
replication_orig_training_curve = plots_figure_2[0]
replication_partial_patch_training_curve = plots_figure_2[1]
replication_full_patch_training_curve = plots_figure_2[2]
Replication experiment
fig = replication_orig_training_curve
fig.axes[0].set_title("Replication: No patching")
fig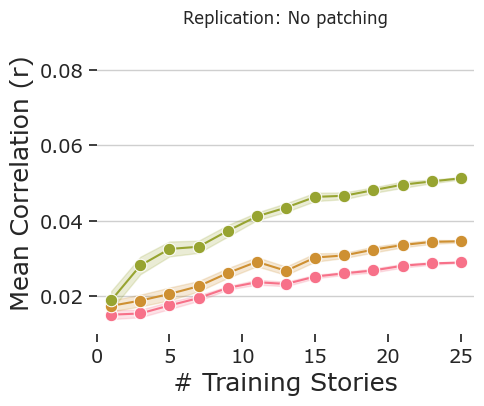
Partial patching
fig = replication_partial_patch_training_curve
fig.axes[0].set_title("Replication: Partial patch")
fig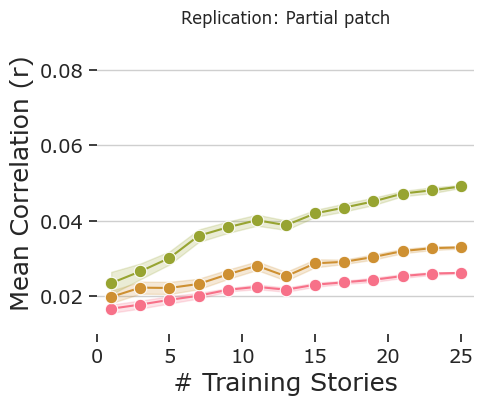
Full patch
fig = replication_full_patch_training_curve
fig.axes[0].set_title("Replication: Full patch")
fig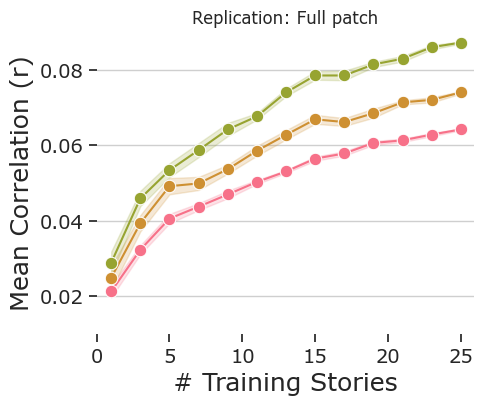
Figure 3 (Extension experiment)
%matplotlib agg
plots_figure3 = plot_figure3(
    extension_ridgeCV_dir=Path(RESULTS_DIR, 'extension_ridgeCV'),
    save_figures=False,
    save_path=None
)
Loading...
extension_training_curve = plots_figure3[0]
extension_brain = plots_figure3[1]
fig = extension_training_curve
fig.axes[0].set_title("Sensory model")
fig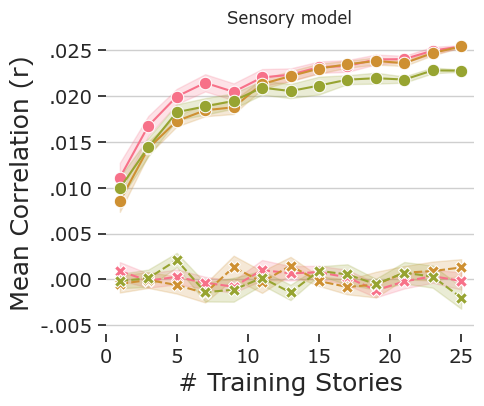
fig = extension_brain
fig.axes[0].set_title("S02")
fig